2012年4月11日,印尼苏门答腊地震发生后,我所王卫民副研究员和地质所姚振兴课题组迅速从IRIS数据中心下载了地震数据资料用于研究地震震源机制和震源破裂过程。选取其中信噪比较高并且沿方位角分布比较均匀的27个远场P波波形(震中距位于 范围之内)数据进行点源模型的震源机制解反演;根据反演结果再利用27个远场P波波形并增加19个SH波波形资料用于震源过程反演。初始破裂点取USGS给出的震中位置。
结果显示该地震断层面近直立,破裂滑动以左旋走滑为主,计算得到的地震矩为4.3×10**21Nm,Mw=8.4。最大滑动3500cm。
震源模型数据:
slipsub.dat
slipsub.par
SubFault.pos
数据说明.doc
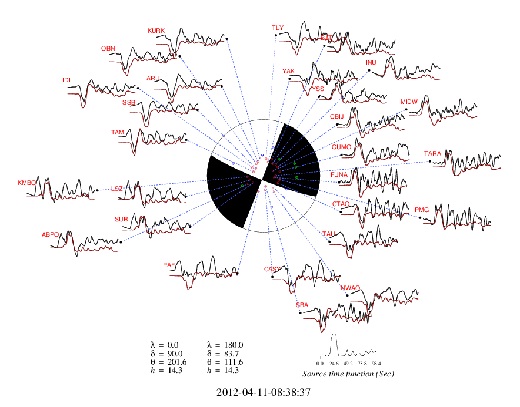
图 1 苏门答腊北部海域8.6级地震震源机制解
采用下半球投影,同时给出了点源模型的P波垂向位移理论图(红线)与资料(黑线)的拟合情况。图形下方给出了两组节面解(左下,λ,δ,θ,h分别表示错动倾伏角、断层倾角、断层走向、震源深度)和点源模型的震源时间函数(右下)。
Figure 1 Focal mechanism of the Mw8.6 earthquake,Off the West Coast of Northern Sumatra.
Lower-hemisphere projection is used here. The observed P wave records (black line) and the synthetic seismogram (red line) based on the simple point model are compared. The parameters of two possible fault planes are listed also, with l, d, q ,h indicating the rake angle, dip angle, strike direction and source depth respectively. The obtained source time function are plotted.
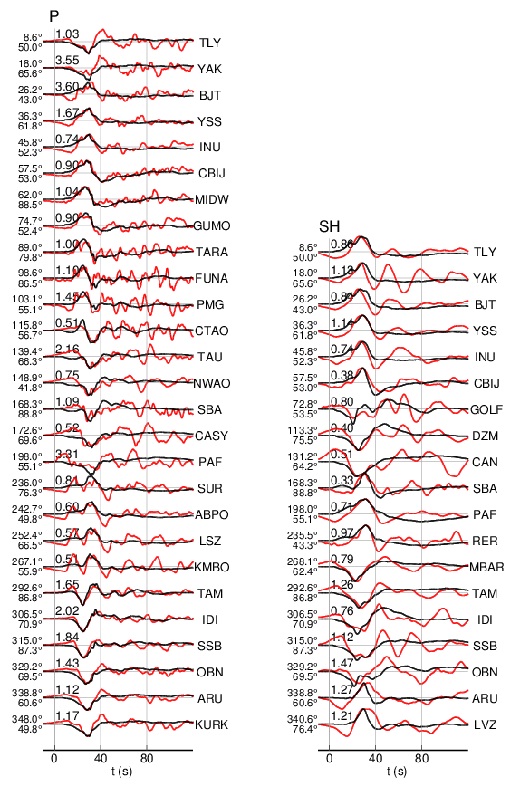
图2 有限断层模型的远场P和SH波形拟合
左列为P波垂向位移理论图(红线)与记录(黑线)的对比;右列为SH波切向位移理论图(红线)与记录(黑线)的对比;并给出每个记录的方位角(左上)、震中距(左下)、振幅比(上)和台站名(右)。
Figure 2 Comparison of the observed teleseismic P and SH records with the synthetic waveforms.
Comparison of observed (black) and synthetic waveforms (red) for P vertical components, and SH components are shown in the panel, the azimuth, epicentral distance, amplitude ratio and station name are also indicated.
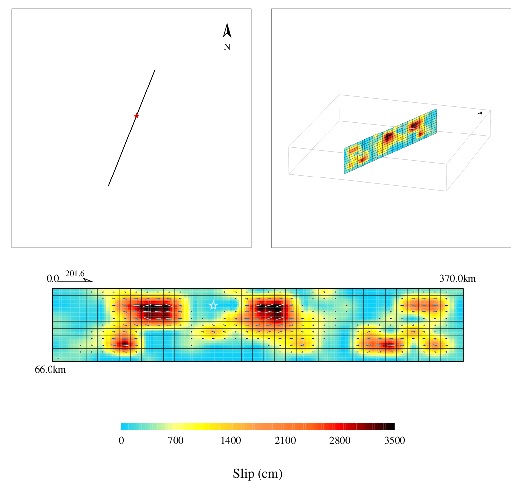
图 3 地震断层面上滑动分布
图中分别给出了有限断层模型的地表投影(左上)和三维示意图(右上)
Figure 3 Inverted slip distribution on the fault.
Surface projection of fault model ( up-left ) and 3D view of the fault model ( up-right ) are shown
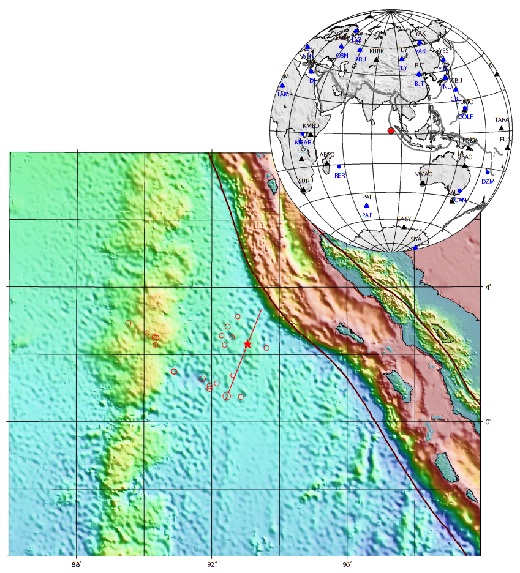
图 4 地震断层投影
上图为反演使用波形记录的台站分布,其中黑色三角为选用P波记录的台站,蓝色圆为选用SH波记录的台站。图中深红色圆点表示主震后6小时的余震分布(USGS)。
Fig. 4 The map shows the projection of slip distribution on the ground
The location of the stations which records are used in source inverse (upper panel): the black triangles and blue circles represent the stations used for P wave and SH wave inversion respectively. The dark red dots indicate aftershocks from USGS after mainshock 6 hours.