

王卫民1 何建坤1 丁林1 郝金来2 姚振兴2
1.青藏高原地球系统与资源环境重点实验室,大陆碰撞与高原隆升团队,中国科学院青藏高原研究所,北京,100101
2.中国科学院地质与地球物理研究所,北京,100029
北京时间2022年9月5日12点52分 (UTC 2022-9-5 04:52:20) 在我国四川省泸定县发生了M6.8级地震。地震发生后,我们从IRIS数据中心下载了地震数据资料用于研究地震震源机制和震源破裂过程。选取其中信噪比较高并且沿方位角分布比较均匀的19个远场P波波形(震中距位于30°<△<90°范围之内)和21个SH波波形资料进行点源模型的震源机制解反演;根据反演结果构建有限断层模型进行震源过程反演,获得了这次地震破裂滑动分布的初步结果。计算得到的地震矩为1.2×10¹⁹Nm,Mw=6.65。最大滑动192cm。
初步结果表明:这次地震为震级Mw6.7,震源深度约13km的高倾角走滑型地震,破裂持续时间约15秒。计算震中区的理论地震烈度(中国地震烈度表,2008)约为IX度。
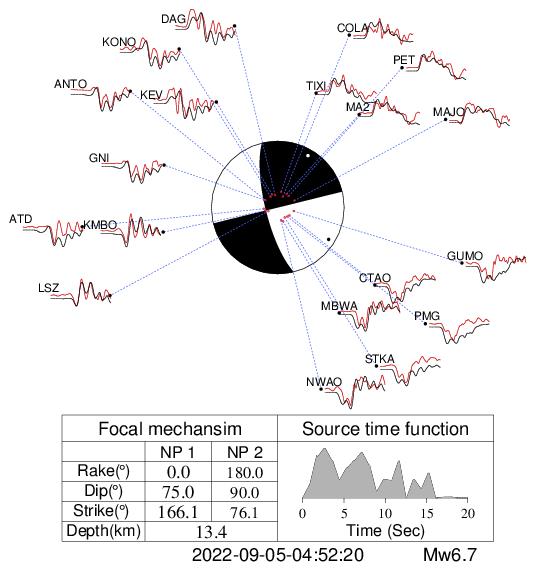
图1 泸定M6.8级地震震源机制解
采用下半球投影,同时给出了点源模型的P波垂向位移理论图(红线)与资料(黑线)的拟合情况。图形下方给出了两组节面解(左下,λ,δ,θ,h分别表示错动倾伏角、断层倾角、断层走向、震源深度)和点源模型的震源时间函数(右下)。
Figure 1 Focal mechanism of the Luding M6.8 earthquake.
Lower-hemisphere projection is used here. The observed P wave records (black line) and the synthetic seismogram (red line) based on the simple point model are compared.The parameters of two possible fault planes are listed also,withλ,δ,θ,h indicating the rake angle,dip angle, strike direction and source depth respectively.The obtained source time function are plotted.
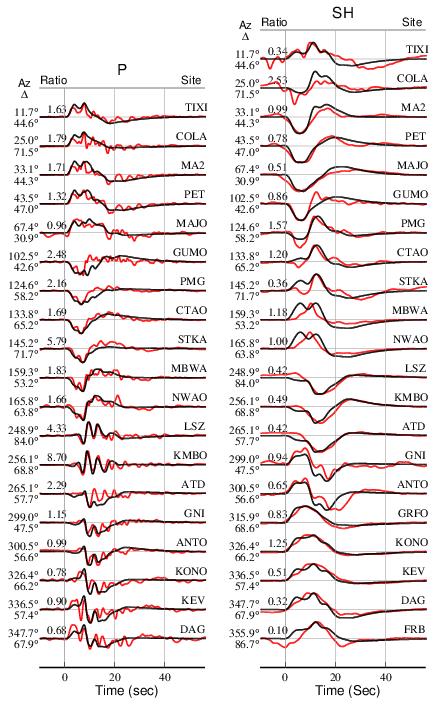
图2 有限断层模型的远场P和SH波形拟合
左列为P波垂向位移理论图(红线)与记录(黑线)的对比;右列为SH波切向位移理论图(红线)与记录(黑线)的对比;并给出每个记录的方位角(左上)、震中距(左下)、振幅比(上)和台站名(右)。
Figure 2 Comparison of the observed teleseismic P and SH records with the synthetic waveforms.
Comparison of observed (black) and synthetic waveforms (red) for P vertical components,and SH components are shown in the panel,the azimuth,epicentral distance, amplitude ratio and station name are also indicated.
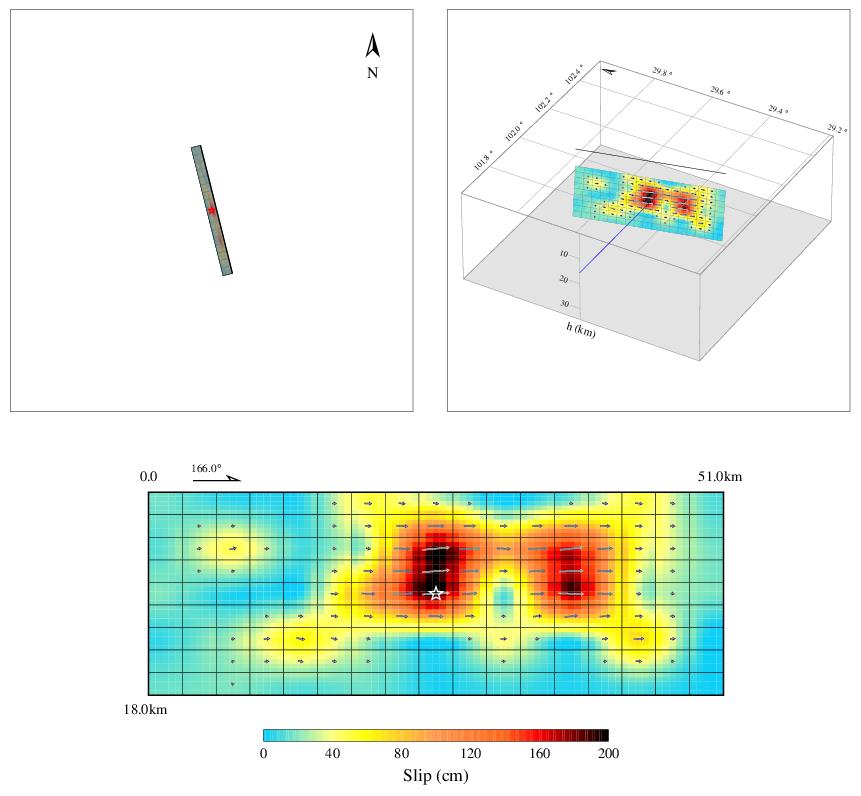
图3 地震断层面上滑动分布
图中分别给出了有限断层模型的地表投影(左上)和三维示意图(右上)
Figure 3 Inverted slip distribution on the fault.
Surface projection of fault model(up-left) and 3D view of the fault model(up-right) are shown
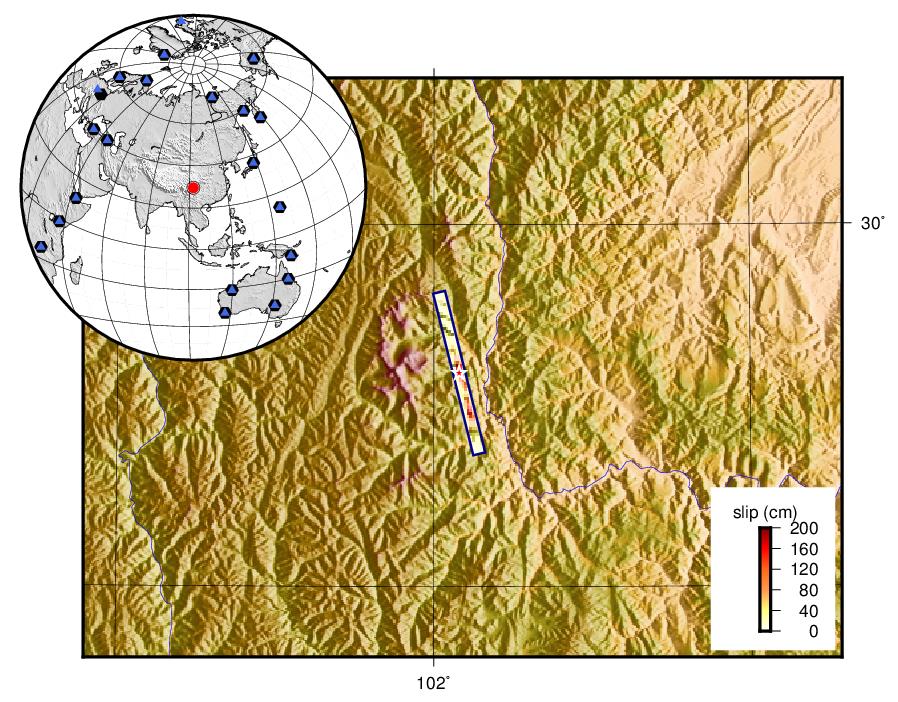
图4 地震断层滑动分布投影
Fig.4 The map shows the projection of slip distribution on the ground
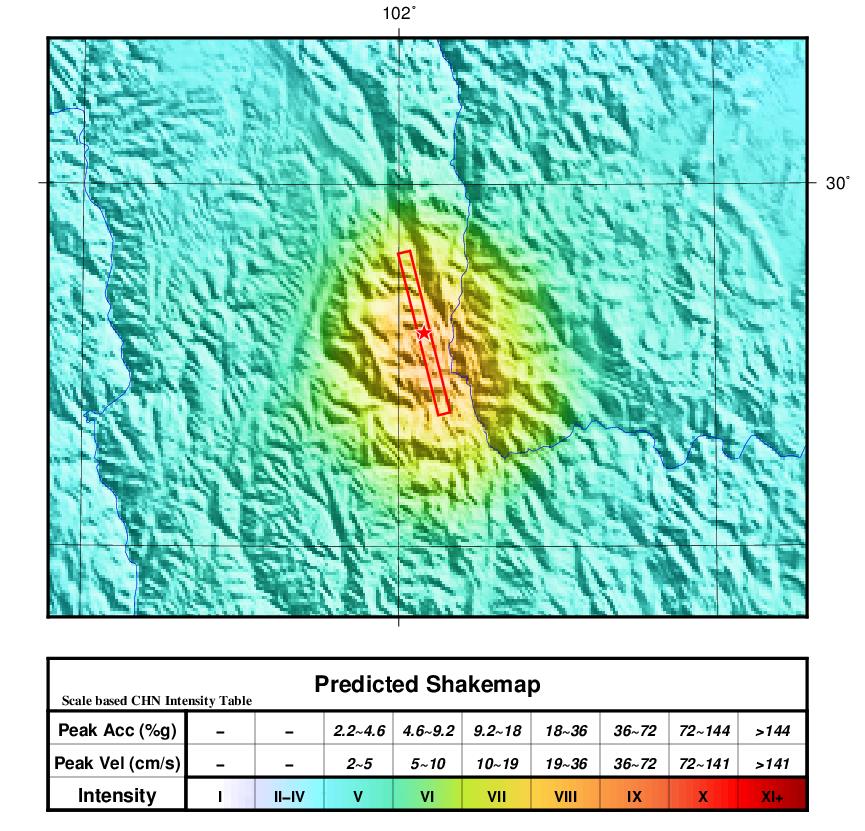
图5 根据破裂过程模型计算的理论烈度分布
Fig.5 Predicted Shakemap calculated from slip model